I asked for my last post to be removed so I can do a bit of on update now I've got time
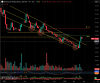
Here's my regular chart I post - nothing's changed other than dates and movements.
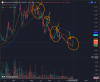
and here's the one I posted this morning
Both of these charts are in a weekly time frame. The first chart has my supports and resistances included.
Using the second chart (with EMAs): Look back to April 2023, the 43EMA (orange line) has acted as resistance on every break so far. At some point that will change but it should also be noted that it has been a reliable indication for the last couple of years.
tongtong noticed this and RNU needs to break above that EMA (he said 50, I said 43 only because that's what I use, 50 is not incorrect) before optimism returns. One observation I can give is that selling volume has not reduced indicating further downward movement is possible.
Yes, you can sell stats and data any way you choose which is why I simply suggested to follow the trends that we all can see. the GMMA in Karen's chart shows a bullish reversal. We can see from the charts using EMAs alone that traditional reversal signals (golden cross etc) have not evolved.
Question: what actors support or resist price movement. In this case the 43w EMA resists. tongtong is correct from my interpretation and I'll posit that my sentiment will change once that 43/50EMA is no longer a resistance and has proven to be a support.
BTW, the 43EMA downfall is flattening and will likely be tested again soonish. Once that breaks, we can look towards the upper resistances 66, 70, 76, etc.
@itsaduster yes, by necessity rather than choice, opportunity cost etc. But I wouldn't suggest selling if you are able to hold out. Wait for the 43/50 and use the cash holding value to your advantage. If you feel like trading it, create your own charts and find out where those determining levels are. I've always been open and honest, I don't like the macro environment ATM and have reduced pretty much all of my stock holdings and am short term speculating only ATM, extremely tight stop losses and take profit rules.
Also, I have been wrong many times and do not believe my interpretation is the only or correct one. So whatever I say relating to charts, I genuinely believe is correct but I'm not perfect.
update:
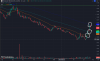
On the 1 day time frame we can see golden crosses, the 9 period (green) has crossed up 43 (orange) and 100 periods (cyan). Resistance was given by the 200 period EMA (blue)
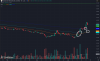
The 4 hr confirms bullish, 9EMA crossed up 43 and 100. 200ema is offering support on the 4hr chart.
So, yes, the chart does appear bullish on the lower time frames. The weekly chart which I prev looked at has not caught up yet.
GLTA
RNU Price at posting:
6.2¢ Sentiment: Hold Disclosure: Not Held
A personalised tool to help users track selected stocks. Delivering real-time notifications on price updates, announcements, and performance stats on each to help make informed investment decisions.


 (20min delay)