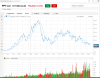
Just noticed the last time PPT was at these levels was the beginning the Century!:
looks like Gold Bars under the bed would have been the GO!
By the way, has the Trump Tariffs already been baked into Gold OR more upside to come?
Surely there's a learned watcher that can put some science to why PPT & AU are trending the way they are?


Add to My Watchlist
What is My Watchlist?
 (20min delay) (20min delay)
|
|||||
|
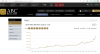
Last
$15.68 |
Change
0.680(4.53%) |
Mkt cap ! $1.797B | |||
| Open | High | Low | Value | Volume |
| $15.25 | $15.83 | $15.24 | $9.181M | 587.4K |
Buyers (Bids)
| No. | Vol. | Price($) |
|---|---|---|
| 2 | 15000 | $15.64 |
Sellers (Offers)
| Price($) | Vol. | No. |
|---|---|---|
| $15.69 | 2346 | 3 |
View Market Depth
| Last trade - 16.10pm 23/04/2025 (20 minute delay) ? |
| PPT (ASX) Chart |